Chart Tales: Data Visualisation & Storytelling Ideas
Welcome to Chart Tales: An AI-powered podcast on Data Visualization & Storytelling Ideas, where we explore Felipe Rego's practical tips, creative ideas, and expert advice to help you master the art of data visualization and storytelling. New episodes every Wednesday 10am AEST. Each episode dives into strategies for planning, building, and delivering impactful data-driven solutions, making complex information clear and engaging. Whether you’re an aspiring data storyteller or a seasoned professional, Chart Tales offers valuable insights to enhance your skills and elevate your presentations. Tune in to learn how to bring your data to life and communicate insights that drive action.
Hosted on Acast. See acast.com/privacy for more information.
- Update frequency
- every 6 days
- Average duration
- 6 minutes
- Episodes
- 11
- Years Active
- 2024

AI Article Review: VizEval
Revolutionizing Data Visualization: Can AI Turn Words into Good Charts? In this episode we explore the Promise, Pitfalls, and Future of NL2VIS Systems from a recent research from a team at Microsoft …
00:11:50 |
Tue 03 Dec 2024

3 Tips to Help You Ask Better Questions for Your Data Viz Projects
In this episode Felipe Rego shares three tips for improving the scoping phase of data, analytics and data visualisation projects: using pauses to gather insights, allowing clients to think aloud, and…
00:06:19 |
Tue 26 Nov 2024

(Loosely) Defining Data Visualisation
In this episode, we briefly and loosely define Felipe Rego's concept of data visualization as a process that involves art and science with the intent to magnify knowledge for those who consume it. P…
00:02:59 |
Tue 19 Nov 2024

4 Ways You Can Help Your Team Build Great Data Visualisation Projects
This episode highlights Felipe Rego's four key strategies for successful data visualization projects: defining the problem clearly, thoroughly exploring data, developing effective visual encodings, a…
00:06:14 |
Tue 12 Nov 2024
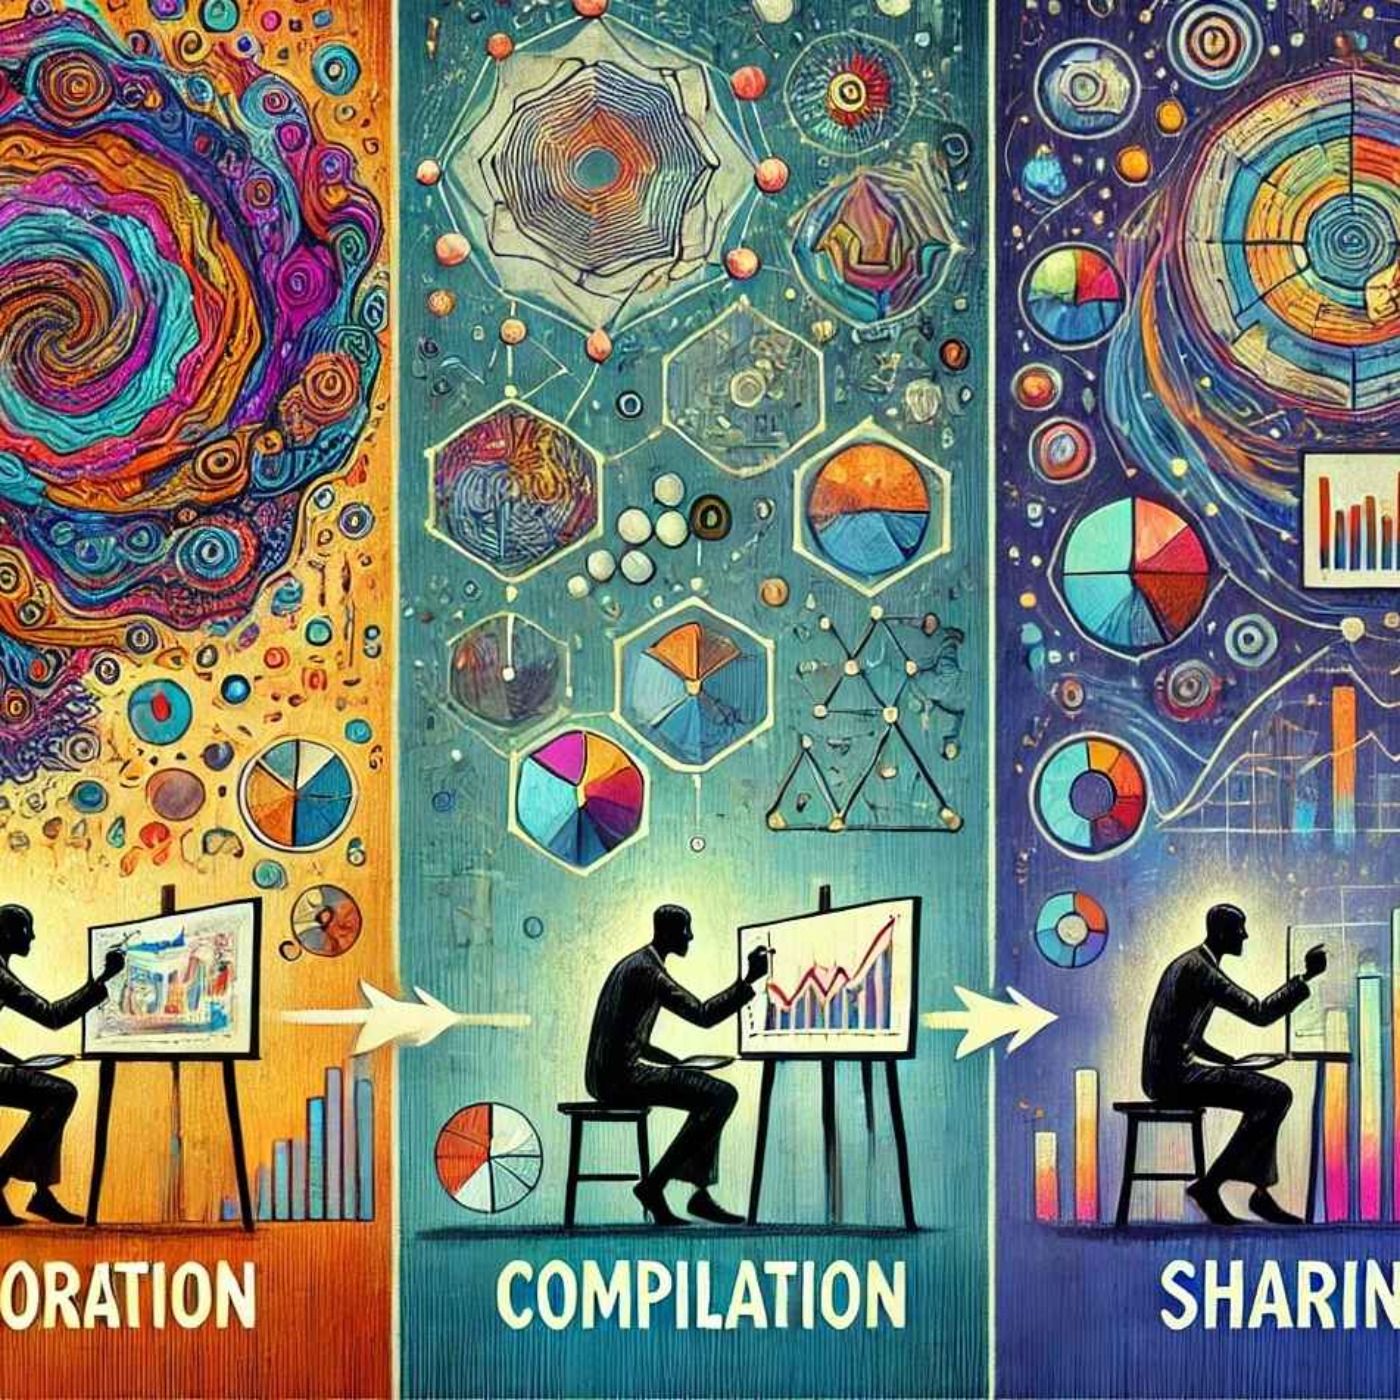
Three Phases of Data Visualization & Storytelling Projects
This episode outlines a three-phase process for successful data visualizations and storytelling solutions: exploration, compilation, and sharing, emphasizing iterative refinement for impactful storyt…
00:03:39 |
Tue 05 Nov 2024

Elevate Your Data Visualisation and Storytelling Skills
This episode offers practical steps based on Felipe Rego's ideas to enhance data visualization and storytelling skills. It emphasizes having a clear objective, using relevant data, designing with the…
00:09:32 |
Tue 29 Oct 2024

Mastering Data Visualisation and Storytelling: A Guide for Leaders
In this episode, Felipe Rego provides leaders with insights on mastering data visualization and storytelling by focusing on foundational visualization techniques, adopting design best practices, craf…
00:05:09 |
Tue 22 Oct 2024

Bad vs Good Data Viz: A Simple Bar Chart Example
Explore the differences between good and bad data visualization through a bar chart example, emphasizing the importance of simplicity, clarity, and logical design choices in telling compelling data s…
00:04:21 |
Tue 15 Oct 2024

Tips for Creating Better-Looking PowerBI Dashboards
To create better-looking PowerBI dashboards, focus on clarity, simplicity, and interactivity. Start with a plan that clearly defines the dashboard's purpose and audience. Simplify by showcasing only …
00:08:43 |
Tue 08 Oct 2024

Data Visualization Predictions for 2025
As we look towards 2025, the landscape of data visualization and storytelling solutions is undergoing a significant transformation, driven mostly by important advances in artificial intelligence (AI)…
00:08:59 |
Wed 02 Oct 2024

Who is Felipe Rego
Felipe Rego is a leading data science, analytics and data visualisation specialist. He develops analytics and data visualization solutions that help transform organizations. Felipe is also an global …
00:03:13 |
Wed 02 Oct 2024
Disclaimer: The podcast and artwork embedded on this page are the property of Felipe Rego. This content is not affiliated with or endorsed by eachpod.com.